Welcome to the RoyOMartin Beyond the Board — your snapshot of housing market trends, company performance, and regional development.
Scroll down to explore the latest edition and see how RoyOMartin continues to meet the needs of today’s housing market.
Key updates on housing affordability, building activity, and industry trends.
A look at RoyOMartin’s role in supporting affordable, resilient construction.
City-by-city permitting, starts, and sales information.
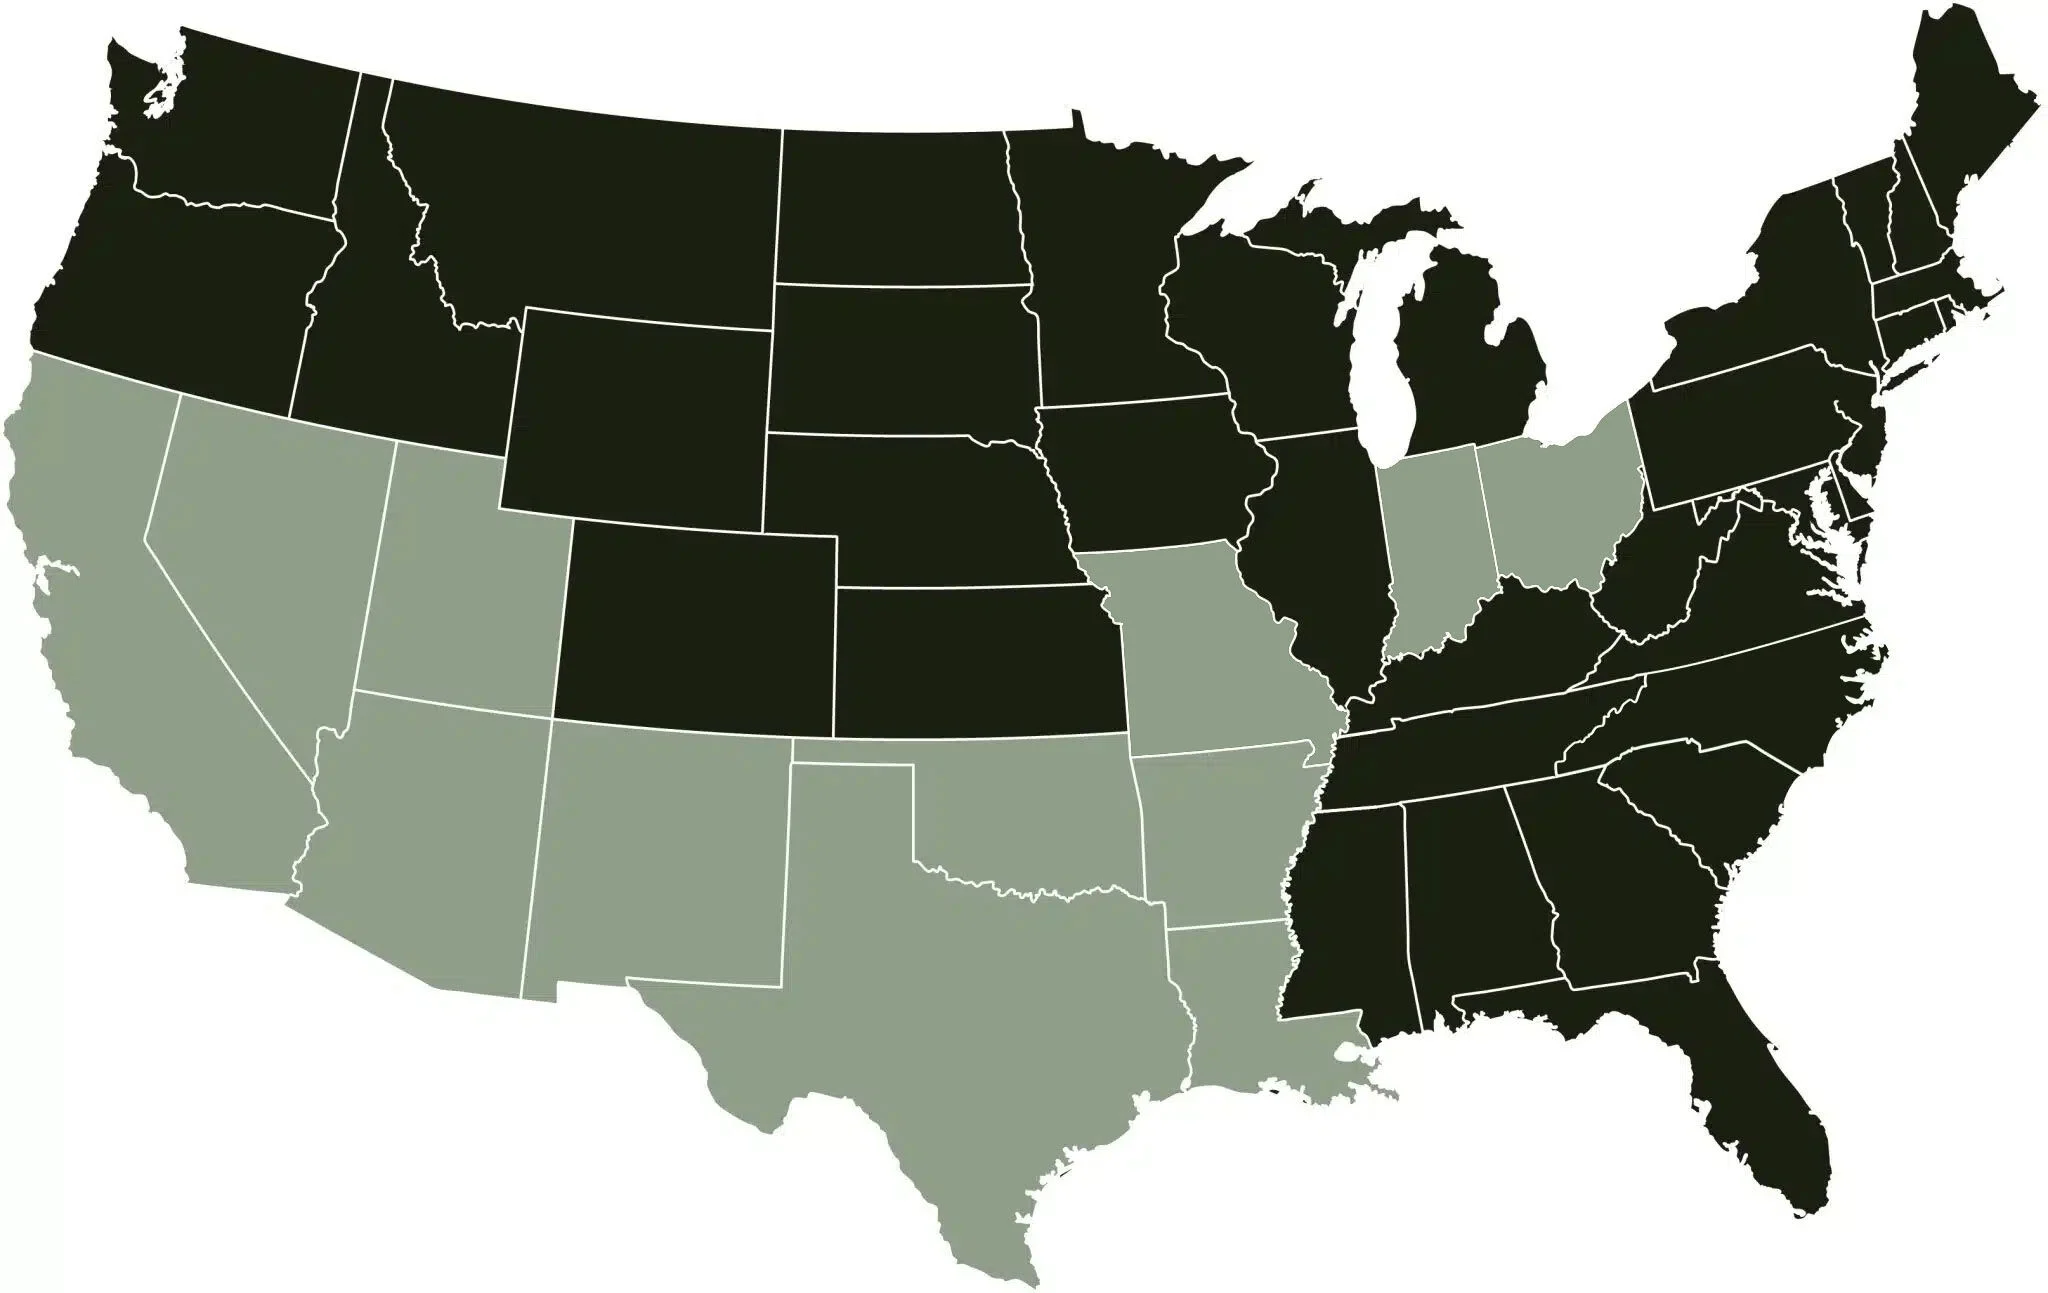
The housing market is not breaking down. It is recalibrating. Production has eased across many regions, but it has not collapsed. Builders are aligning starts and permits more closely with today’s demand, while inventory has risen enough to give buyers more choice. In several Western markets, supply is now elevated, while much of the Midwest and smaller metros remain closer to balance. Buyers are still active, just more measured in how they move.
Affordability remains the defining pressure point. Markets with higher valuation strain are seeing slower absorption, more pricing sensitivity, and cautious buyer behavior. At the same time, steady performers like Kansas City, Indianapolis, and Oklahoma City continue to show that balanced fundamentals still work. These markets are not chasing growth; they are sustaining it, with manageable inventory and stable production.
A large share of the country sits in the middle, including Texas and parts of the Mountain West, where conditions are steady but no longer running hot. Looking ahead, markets like Phoenix, Dallas-Fort Worth, Salt Lake City, Provo, and Reno are well-positioned for recovery once confidence improves. The pattern is clear. This cycle is rewarding discipline over speed. Balanced markets are continuing to move forward. And it is a reminder that even in a slower environment, steady execution and disciplined decisions keep us Building Tomorrow Together.
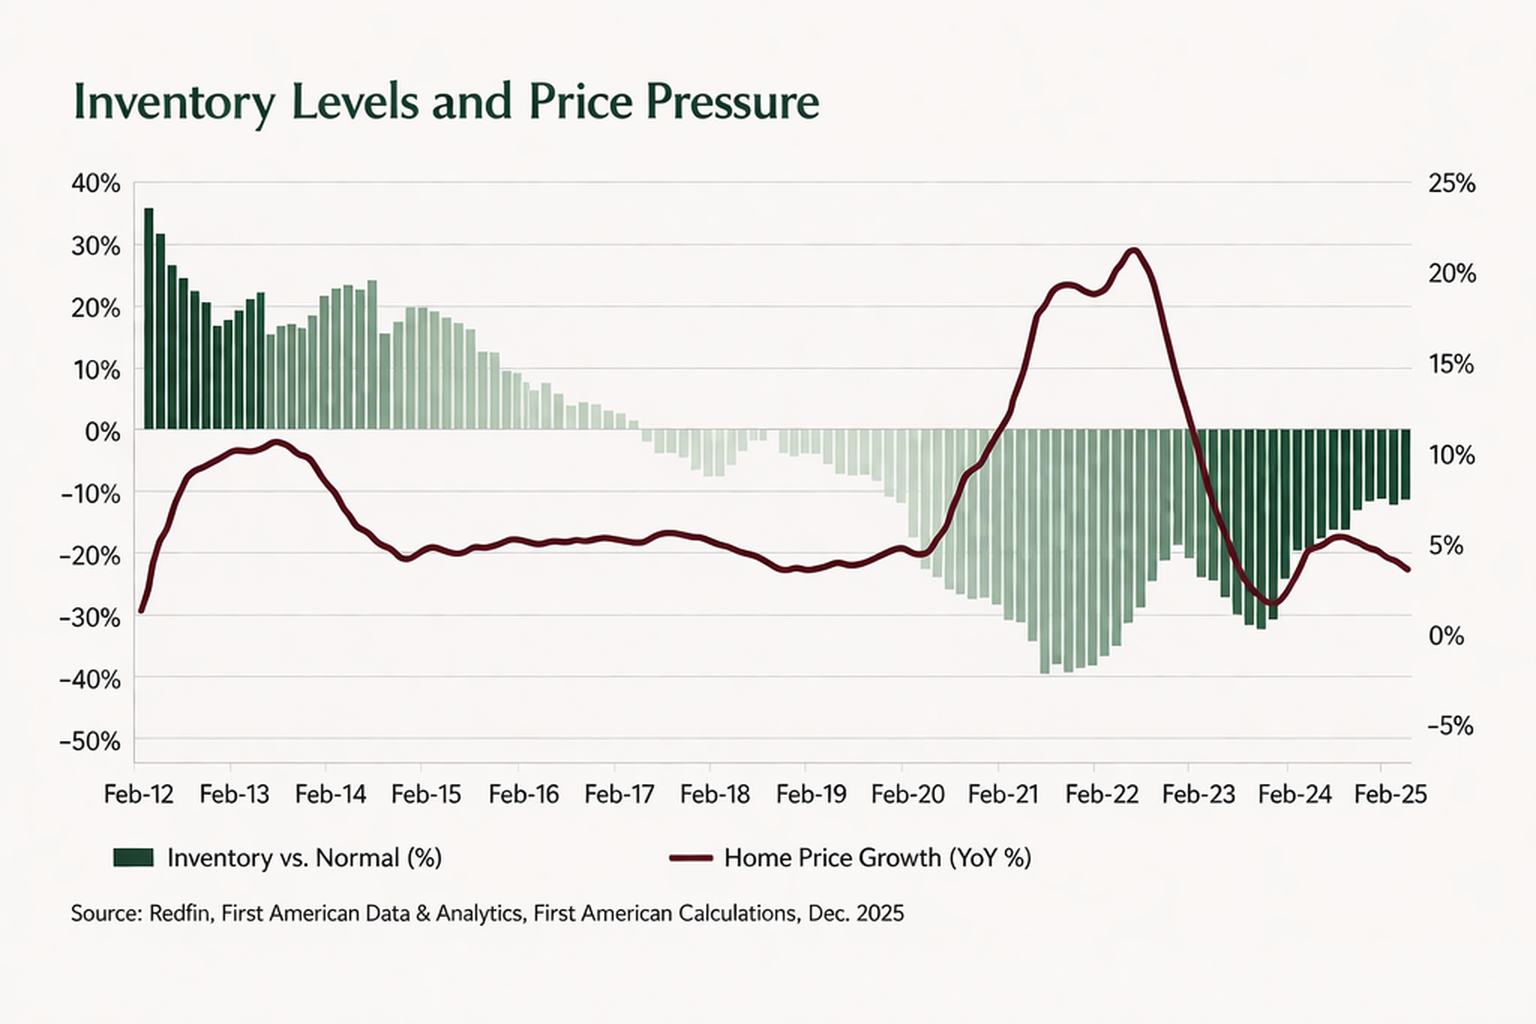
Housing inventory has shifted from well below normal levels to a meaningful surplus in the last couple of years, while price growth has slowed sharply from its 2021 peak. As inventory has increased, price appreciation has cooled, reinforcing the inverse relationship between supply and price pressure.
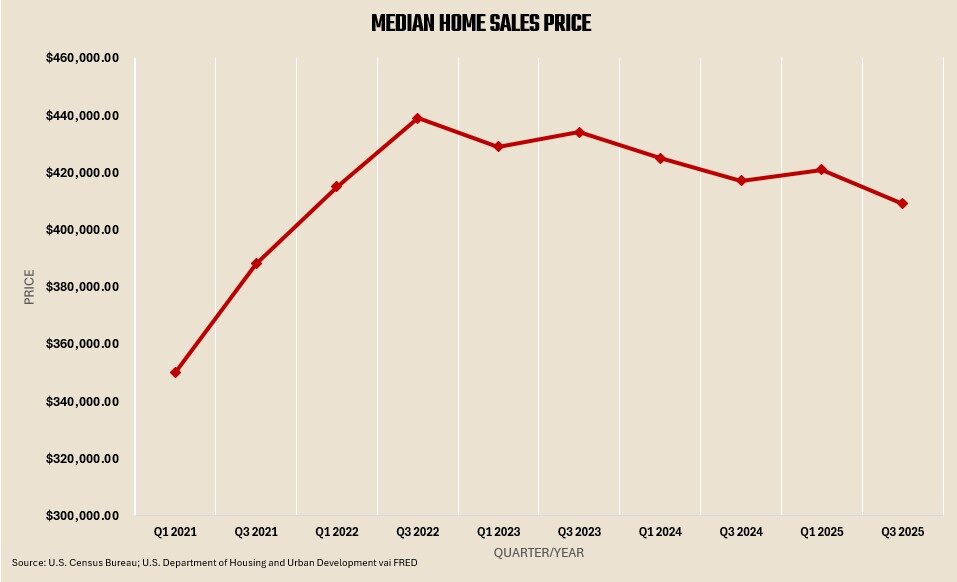
Home prices climbed sharply from 2021 through mid-2022, reaching a peak before softening and becoming more volatile through 2023–2025. Overall, prices have stabilized slightly below peak levels but remain elevated compared to pre-pandemic values.
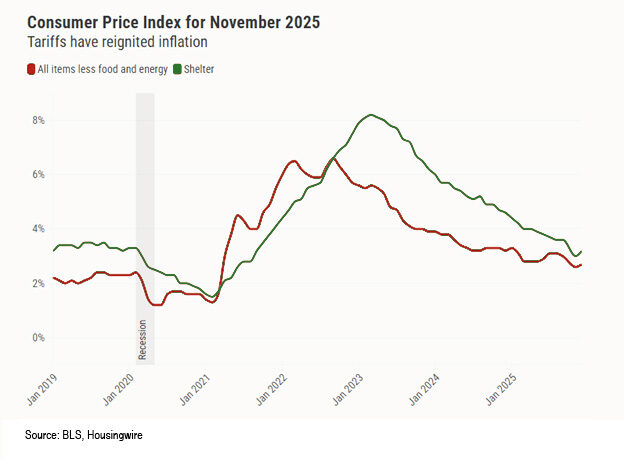
Inflation surged through 2021–2022, peaking in 2022–2023, before steadily easing into 2024 and 2025. However, both core inflation and shelter costs remain elevated relative to pre-pandemic levels, suggesting persistent underlying price pressure.
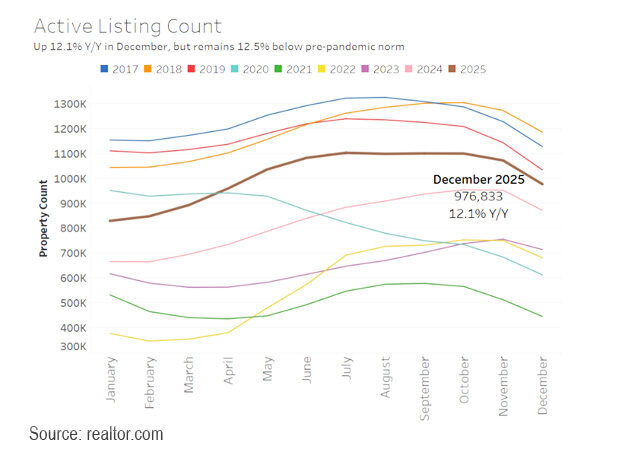
Active listings rose modestly in 2025, finishing December up 12.1% year-over-year, but still below pre-pandemic levels. Inventory followed a typical seasonal pattern—building through midyear before tapering off into year-end—while remaining meaningfully lower than peak years like 2017–2019.
Sources:
We’re constantly uncovering new ideas and industry perspectives. Check back soon for upcoming episodes, innovations, and stories that move the forest products industry forward.
7.2
Albuquerque continues to wrestle with a long-standing housing shortage, but the pace of new single-family activity has clearly cooled from last year. Multifamily is carrying more of the load right now, which tells you where builders see steadier demand. Inventory has inched up enough to give buyers a little more breathing room, though it is hardly an oversupplied market. The underbuilt position still sits in the background, reminding everyone that the long-term need has not gone away. It feels like a market that is recalibrating rather than retreating. Most folks would welcome a little more consistency in starts before calling it steady again.
New home closings are up 9.7% year over year, showing steady demand on the for-sale side.
Multifamily permits have surged 136.2% year over year, signaling renewed rental development activity.
Louisiana Economic Development reports SNT Motiv and SNT Energy investing $594 million in East Baton Rouge Parish, bringing an estimated 693 new jobs into the market.
Single-family starts are down 8.56% year over year, reflecting a pullback in production.
The unemployment rate sits at 4.3% and is trending higher, while foreclosures have increased locally this year.
Single-family permits are off 2.2% from last year, suggesting a softer pipeline ahead.
Baton Rouge feels steady, but not particularly fast. Builders have eased back on single-family production, even as closings have held up reasonably well. The sharp jump in multifamily permitting stands out and suggests developers see opportunity on the rental side. Job growth is modest, and a few economic development wins help reinforce the longer-term story. At the same time, rising unemployment and foreclosure activity are worth watching. It is a market that looks stable, though not immune to pressure.
7.2
The region remains a national draw, ranking #2 on Zonda’s 2025 Baby Chaser Index, supported by Millennial and Baby Boomer migration trends.
Despite the slowdown, starts still total 14,617 units annually, reflecting a market that continues to produce at scale.
The market is nearly balanced at 0.6% underbuilt, suggesting long-term supply and demand are closer to alignment than many high-growth metros.
Starts are down 14.7% year over year, showing builders have pulled back meaningfully from prior pace.
Multifamily permits have fallen 40.2% year over year, signaling a sharp contraction in the apartment pipeline.
With 7.2 months of supply and 92 median days to pending, absorption has slowed and buyers are taking their time.
Austin is still Austin. The long-term migration story is intact, and the region continues to attract households at a healthy clip. That said, the production engine has clearly shifted into a lower gear compared to the boom years. Builders are managing risk more carefully, especially on the multifamily side, and buyers are moving with less urgency. Inventory has normalized, giving the market a more balanced feel than we saw a few years ago. It does not look distressed, but it is no longer running hot. If confidence firms up, this market has the fundamentals to respond.
6.8
The region added 41,441 jobs year over year, reinforcing DFW’s position as a national employment hub.
Despite the pullback, 42,402 annual starts reflect scale and depth that few metros can match.
Major corporate investment continues, including Scotiabank’s new U.S. headquarters in Dallas, bringing over 1,000 jobs.
Starts are down 9.3% year over year, showing builders have eased off prior production levels.
With 6.8 months of supply and 65 median days to pending, homes are moving more slowly, and buyers have more leverage
Single-family permits are down 14.9% from last year, signaling a more cautious forward pipeline.
DFW is still one of the country’s workhorses, but it is clearly operating at a more measured pace than the peak years. Builders have trimmed starts and permits as the market digests prior volume, and buyers are taking a little more time to make decisions. Even so, the job engine continues to run, and corporate relocations keep reinforcing the long-term growth story. Inventory feels more balanced than tight, which is healthy, though not as exciting. This is a market recalibrating, not retreating. If confidence firms up, the underlying fundamentals are there to support it.
Annual job growth is running at 2.5%, adding 7,774 jobs and supporting steady household formation.
Median new home pricing remains competitive relative to national levels, preserving an affordability advantage within the region.
The market remains 1.3% undersupplied, reinforcing underlying housing demand.
Single-family starts are essentially flat, down 0.29% year over year, showing limited production growth.
Single-family permits are down 5.3%, and multifamily permits are down 10.8%, signaling a softer forward pipeline.
New home closings are down 2.1% year over year, and recent job losses tied to the Cargill plant closure add local economic pressure.
Northwest Arkansas still has good fundamentals working in its favor. Job growth is solid, and the market remains slightly undersupplied, which keeps a firm floor under demand. That said, production has leveled off, and the permit pipeline suggests builders are being more measured right now. Sales have eased a bit, and the Cargill closure is something folks will watch closely in the coming quarters. Even so, affordability relative to many other markets continues to be a draw. This feels like a steady market that is catching its breath, not losing its footing.
7.2
Houston feels steady but watchful. Builders have trimmed single-family permitting while multifamily developers are still leaning in, which suggests a shift in where demand is perceived to be strongest. Closings have held up, and the scale of this market continues to provide stability. At the same time, energy sector restructuring is a reminder that Houston’s economy can shift quickly. Inventory is more balanced than tight, and buyers are moving at a measured pace. This is a market with solid fundamentals, but one that is clearly navigating crosscurrents.
Lafayette is showing a bit more life on the single-family side. Starts and sales have both moved higher, which is a good sign in a market that has been fairly flat in recent years. Multifamily development has slowed considerably, so most of the activity is centered around for-sale housing. Job growth is modest, and some softness in higher-income sectors bears watching. Even so, the market remains slightly undersupplied, which helps support demand. This one feels stable, with incremental improvement rather than big swings.
5.6
The market remains 9.4% underbuilt, reinforcing underlying long-term housing demand.
Multifamily permits have surged 125.6% year over year, signaling renewed rental development momentum.
A 102-unit condo project in Summerlin MP is moving forward, adding for-sale inventory targeted toward lock-and-leave buyers.
Starts are down 9.4% year over year, reflecting a pullback in production.
Annual job growth is slightly negative at -0.1%, and the economy remains heavily tied to tourism, where visitor volumes have softened
Single-family permits have declined 12.5%, pointing to a softer forward pipeline on the for-sale side.
Las Vegas is adjusting. Builders have eased back on single-family production, even as multifamily activity has jumped sharply. Sales are moving, but not at the pace we saw during the stronger tourism cycles. Employment growth has flattened, and with so much of the local economy tied to hospitality, that matters here more than in most markets. Inventory feels more balanced than tight, giving buyers options and slowing urgency. Even so, the market remains structurally underbuilt, which should help keep a floor under demand. This one feels like it is recalibrating to a more sustainable rhythm.
Starts are up 40.38% year over year, showing a meaningful acceleration in production.
Single-family permits have increased 23.6%, pointing to a stronger forward pipeline.
The market remains 6.0% underbuilt, and the Port of Little Rock’s $1 billion data center project adds long-term economic support.
New home sales are down 1.5% year over year, indicating absorption has not kept pace with rising production.
Median new home pricing is slightly lower year over year, reflecting some pricing pressure.
Regulatory changes under Act 314 have created uncertainty around construction in ETJs, slowing some development activity.
Little Rock has clearly picked up speed on the production side. Builders are leaning in, and the permit pipeline suggests confidence in underlying demand. At the same time, sales have not moved higher, so the market is working to absorb the additional volume. The region’s affordability and infrastructure investment continue to make it attractive, especially relative to larger neighboring metros. Regulatory adjustments have added a layer of complexity, but the overall housing deficit remains supportive. This feels like a market pushing forward, just making sure demand keeps up with supply.
18.2
LA/OC is home to 11 Fortune 500 headquarters and remains a global trade hub, with the Ports of Los Angeles and Long Beach handling a combined 30% of U.S. container traffic.
Single-family permits are up 9.0% year over year, signaling some forward momentum on the for-sale side.
The market remains 1.3% underbuilt, reflecting a long-term structural housing deficit.
Starts are down 23.1% year over year, and closings are down 28.4%, showing a significant production pullback.
With 18.2 months of supply and 6.4 months of finished vacant inventory, the market is carrying elevated inventory levels.
The region is 21.6% overvalued, and ongoing weakness in the entertainment sector continues to weigh on higher-wage employment.
Los Angeles feels heavy right now. Production has slowed considerably, and sales are not moving with much urgency. Inventory has built up to levels that give buyers leverage, and pricing remains stretched relative to incomes. The entertainment industry slowdown is not a small factor here, especially in certain submarkets. At the same time, this is still one of the most economically diverse and globally connected regions in the country. Long-term housing demand does not disappear in a market like this, but near-term, it is clearly working through some pressure.
10.5
Starts are up 32.5% year over year, reflecting a meaningful rebound in production.
Multifamily permits have increased 18.6%, showing developers are leaning into rental demand.
The WonderBlock mixed-use development in downtown Ogden is progressing toward a 2027 completion, adding 350 housing units along with office and retail space to support downtown revitalization.
Closings are down 1.3% year over year, indicating sales have not fully kept pace with the rise in starts.
With 10.5 months of housing inventory and 3.0 months of finished vacant supply, the market is carrying elevated inventory levels.
Median new home pricing is down 11.5% year over year, and days to pending have lengthened, suggesting buyer caution.
Ogden is clearly trying to find its footing again. Builders have stepped production back up in a noticeable way, and multifamily activity shows confidence in longer-term demand. At the same time, absorption has been softer and inventory has built up enough to slow decision-making. Pricing adjustments tell you buyers are being selective. The downtown investment story is encouraging and adds a layer of long-term optimism. For now, this feels like a market working through supply while it waits for demand to firm up.
Starts are up 16.9% year over year, showing solid production growth.
Multifamily permits have increased 10.5%, and single-family permits are slightly higher, pointing to continued pipeline activity.
ARL Bio Pharma’s new $6.7 million research lab, expected to create over 400 jobs, adds meaningful long-term employment support.
With 8.9 months of housing inventory and 3.8 months of finished vacant supply, the market is carrying elevated inventory levels.
Forecasts show job and household growth tapering in 2026 and 2027, suggesting slower momentum ahead.
The market is 24.9% overvalued, keeping affordability pressure in play despite recent growth.
Oklahoma City continues to show steady forward motion. Builders have increased starts, and the permit pipeline suggests confidence is still there. Sales are moving, though inventory has built enough to give buyers more breathing room. The local economy remains relatively stable, and new corporate investment reinforces that foundation. At the same time, valuation and longer-term growth forecasts suggest the pace may moderate. For now, this feels like a healthy, balanced market that is growing without getting ahead of itself.
5.9
Annual closings reached 22,543, up 1.4% year over year, marking the highest observed closing volume since 2022.
The market remains 1.1% underbuilt, reflecting a relatively balanced long-term supply position.
A 226-unit luxury senior living project in Old Town Scottsdale and a 345-unit apartment community in Chandler Farms highlight continued large-scale development activity.
Starts are down 14.7% year over year, and both single-family and multifamily permits have declined sharply, signaling a more cautious production pipeline.
New home sales have softened and the pending sales index is down 15.2% year over year, pointing to slower forward momentum.
The market is 22.3% overvalued, and unemployment has ticked up to 3.7%, adding some affordability and economic pressure.
Phoenix feels like it is shifting into a more measured phase. Builders have pulled back on new starts and permits, even as closings have held up better than many expected. Inventory levels are more balanced than tight, and buyers are taking their time, especially with pricing still stretched relative to incomes. The long-term growth story tied to migration and household formation remains intact, but near-term momentum has cooled. Development activity is still moving forward, just with more discipline. This looks like a market recalibrating after several fast years.
8.1
Starts are up 14.2% year over year, reflecting renewed production momentum.
Multifamily permits have increased 39.8%, signaling strong rental pipeline activity.
Lehi’s semiconductor expansion, including Texas Instruments’ 2.5M sq. ft. facility and Apple’s additional investment, is reinforcing the region’s high-tech employment base.
Closings are up only 3.1% year over year, trailing the pace of new starts.
With 8.1 months of housing inventory and 2.2 months of finished vacant supply, the market is carrying elevated inventory levels.
Rapid population growth continues to strain infrastructure, with traffic congestion and air quality concerns weighing on livability.
Provo-Orem-Lehi continues to benefit from a strong tech-driven growth story. Builders have picked production back up, and multifamily activity shows confidence in the area’s long-term demand. At the same time, inventory has built up enough to slow the rhythm of sales, and buyers are being more deliberate. The economic foundation tied to advanced manufacturing and technology remains a real strength. Infrastructure pressures are part of the growing pains that come with success. Overall, this feels like a market with solid fundamentals that is working to stay balanced as it expands.
6.7
Closings are up 14.7% year over year, showing improved absorption even as starts have eased.
The market remains 5.0% underbuilt, reinforcing underlying long-term housing demand.
The New Home Pending Sales Index is up 14.3% year over year, pointing to better forward sales momentum.
Starts are down 12.1% year over year, and both single-family and multifamily permits have declined, signaling a softer production pipeline.
The region is 22.3% overvalued, keeping affordability pressure in play.
Reno ranks in the bottom half of Zonda’s top 100 markets for new home affordability, limiting buyer flexibility despite being underbuilt.
Reno looks like a market trying to steady itself. Builders have pulled back on new starts and permits, but closings and pending activity suggest buyers are still engaged. Inventory feels more balanced than tight, and pricing remains stretched relative to incomes. The area continues to benefit from in-migration and its lifestyle appeal, though affordability is clearly part of the conversation. Being underbuilt gives the market a structural cushion, even if near-term production has cooled. This one feels measured, with cautious optimism rather than acceleration.
7.5
The Sacramento Railyards project is set to create nearly 13,600 on-site jobs and generate $2.4B in annual wages, reinforcing long-term economic momentum.
Single-family permits are essentially flat year over year at 0.4% growth, showing relative stability in the for-sale pipeline.
The region remains 4.7% underbuilt, supporting underlying housing demand fundamentals.
Starts are down 15.6% year over year, reflecting a meaningful production pullback.
Closings are down 9.2% year over year, and the pending sales index is off 19.1%, pointing to softer near-term absorption.
Multifamily permits have declined 16.5%, signaling contraction on the rental development side.
Sacramento feels like it is in a cooling phase. Builders have eased off starts, and sales activity has slowed enough to build a more balanced inventory position. At the same time, the single-family permit pipeline has held relatively steady, which suggests long-term confidence has not disappeared. Large-scale projects like the Railyards redevelopment continue to anchor the region’s economic outlook. Affordability remains stretched, but this market still benefits from buyers priced out of deeper coastal California. For now, it looks steady, just operating at a lower tempo than a year ago.
11.3
Starts are up 22.1% year over year, showing builders have increased production.
Multifamily permits have surged 86.8%, pointing to strong rental pipeline expansion.
The Power District redevelopment is underway, bringing mixed-use density, new housing units, and major office investment that strengthens long-term urban demand.
Closings are down 14.9% year over year, indicating absorption has not kept pace with rising starts.
With 11.3 months of housing inventory and 3.6 months of finished vacant supply, the market is carrying elevated inventory levels.
Single-family permits are down 3.2% year over year, suggesting some caution on the for-sale pipeline.
Salt Lake City has clearly picked production back up, particularly on the multifamily side. Builders are leaning in, but sales have not kept up with the increase in starts, and inventory levels reflect that imbalance. The broader economic backdrop remains solid, and large-scale redevelopment projects are adding long-term confidence to the urban core. At the same time, buyers are moving more deliberately, and the market is working through added supply. This feels like a market expanding with optimism, but still looking for tighter alignment between production and demand.
6.2
Starts are up 1.0% year over year, and closings have increased 1.5%, showing steady production and absorption.
The Austin-San Antonio corridor continues to benefit from strong academic institutions and growth in advanced manufacturing, life sciences, cybersecurity, and logistics.
Household growth remains solid at 1.8%, reinforcing underlying housing demand across the region.
Single-family permits are down 16.0% year over year, pointing to a more cautious forward pipeline.
Multifamily permits have fallen 48.7%, signaling a sharp pullback in apartment development.
Finished vacant inventory has risen to 2.5 months of supply, above the market’s long-term average, reflecting added pressure on absorption.
San Antonio feels steady, but not without some caution underneath. Starts and closings are holding their ground, which speaks to the depth of demand along the I-35 corridor. At the same time, the permit pipeline has clearly tightened, especially on the multifamily side, suggesting builders are being more selective about what comes next. Inventory is more balanced than it was a year ago, giving buyers a bit more room to think. The long-term growth story tied to jobs and household formation remains intact. For now, this looks like a market that is stabilizing after a fast run, not one that is pulling back dramatically.
17.4
Starts are up 1.0% year over year, and closings have increased 14.2%, showing improved absorption relative to last year.
Single-family permits are up 10.2%, signaling forward momentum on the for-sale side.
The San Diego Planning Commission approved updates to streamline historic preservation rules, helping reduce friction for future housing development.
With 17.4 months of housing inventory and 12.0 months of under-construction supply, the market is carrying elevated inventory levels.
Multifamily permits are down 5.0% year over year, reflecting softer rental pipeline activity.
The region remains 22.1% overvalued, and unemployment has ticked up to 4.5%, adding affordability and economic pressure.
San Diego is showing better sales momentum than a year ago, but it is also working through a sizable inventory build. Builders have kept starts slightly higher, and single-family permitting suggests some confidence in the for-sale segment. At the same time, supply levels are elevated enough to slow the pace and give buyers leverage. Pricing remains stretched relative to incomes, which keeps affordability front and center in this market. The regulatory adjustments are a constructive step, but this is still a high-cost environment. For now, it feels like a market balancing improved demand against a heavier supply load.
22.2
Single-family permits are up 19.5% year over year, and multifamily permits have increased 40.2%, signaling renewed pipeline activity.
Senate Bill 79 allows denser multifamily housing near major transit corridors, opening new development opportunities in high-demand areas.
Salesforce’s $15B AI investment in San Francisco, including a new AI incubator hub and 2K sales roles, reinforces the region’s long-term tech employment base.
Starts are down 25.2% year over year, reflecting a significant production pullback.
Closings are down 42.7% year over year, and the pending sales index is down 12.0%, showing soft demand conditions.
With 22.2 months of housing inventory and 12.0 months of under-construction supply, the market is carrying elevated inventory levels.
The Bay Area is still working through a reset. Production has slowed materially, and sales momentum has been uneven, leaving the market with a heavy supply position. At the same time, the permit pipeline suggests developers are positioning for a longer-term opportunity, particularly with new density allowances near transit. Tech investment remains a defining strength, even as job growth has cooled in the near term. Pricing is elevated and affordability remains a challenge, but this is still one of the country’s most structurally constrained housing markets. For now, it feels like a market in transition, balancing softer demand against long-run economic depth.
5.8
Closings are at 3,617 annually, down only 3.0% year over year, holding up better than starts.
Total housing inventory has declined since the start of the year, with 3.7 months under construction and 1.8 months of finished vacant supply, keeping overall supply relatively contained.
Household growth is running at 1.3%, and median household income is projected to rise 3.7% annually over the next two years, supporting longer-term demand.
Starts are down 13.4% year over year, and both single-family and multifamily permits have declined, signaling a thinner forward pipeline.
The new home pending sales index is down 21.9% year over year, pointing to softer near-term momentum.
The market is 23.2% overvalued, and two of the three high-income job sectors posted year over year losses, while foreclosures have increased over the past twelve months.
Tucson feels like it is in a cooling phase after a stronger stretch. Builders have eased back on production, and the pending index suggests buyers are moving more cautiously right now. At the same time, overall inventory is not excessive, and closings have held up better than starts. Affordability remains a challenge given valuation levels, but steady household growth and rising incomes offer some underlying support. This is a market that looks stable, just operating with less urgency than it did a year ago.
Starts are up 10.4% year over year, and closings have increased 18.2%, showing solid production and absorption momentum.
Multifamily permits have surged 97.3% year over year, signaling renewed confidence in rental development.
The Osage Nation’s $500 million investment into a drone innovation hub and aerospace industry expansion is helping attract tech firms and strengthen the local job base.
Single-family permits are down 3.7% year over year, pointing to a slightly softer forward pipeline on the for-sale side.
The market is 26.2% overvalued, keeping affordability pressure in place despite steady job growth.
An independent housing study estimates the city needs roughly 13,000 additional units over the next decade, and current permit activity does not yet match that long-term demand.
Tulsa feels steady and quietly confident. Production and closings have both moved higher, which tells you demand is present, and builders are responding. The surge in multifamily permitting stands out and suggests developers see room on the rental side. At the same time, affordability remains a real constraint, and the single-family pipeline has softened a bit. The broader job market is healthy, with new investment adding energy to the tech and aerospace story. Overall, this looks like a market with solid footing, just needing supply to keep pace over the long haul.
Columbus continues to feel like a fundamentally healthy market, but one that is adjusting. Builders have eased back slightly on starts and single-family permits, even as closings have held up well. Multifamily is carrying more of the growth right now, which lines up with shifting affordability pressures. Resale inventory is giving buyers more options, so new home competition is a bit stiffer than it was a year ago. Even so, job and household growth remain steady, and the development pipeline in places like Delaware County shows confidence in the long game. This one feels balanced, just more competitive.
Indianapolis continues to look like a steady Midwestern performer. Production has edged higher and closings are moving well, which tells you demand is still present. At the same time, permitting has flattened out and multifamily developers have clearly tapped the brakes. Inventory has built enough to slow the pace of decision-making, but not to a concerning level. New community activity in places like Zionsville shows builders are still confident in long-term demand. This feels like a balanced market that is growing, just without a lot of flash.
Kansas City is building again. Permits and starts have moved higher, and the supply side is clearly leaning forward. The challenge is that sales have eased a bit, so the market is working to find its balance. Employment growth has flattened, which may explain some of the hesitation we are seeing from buyers. Even so, the region remains modestly undersupplied, and long-term fundamentals are still intact. This feels like a market pushing forward, just making sure demand keeps up with the pace.

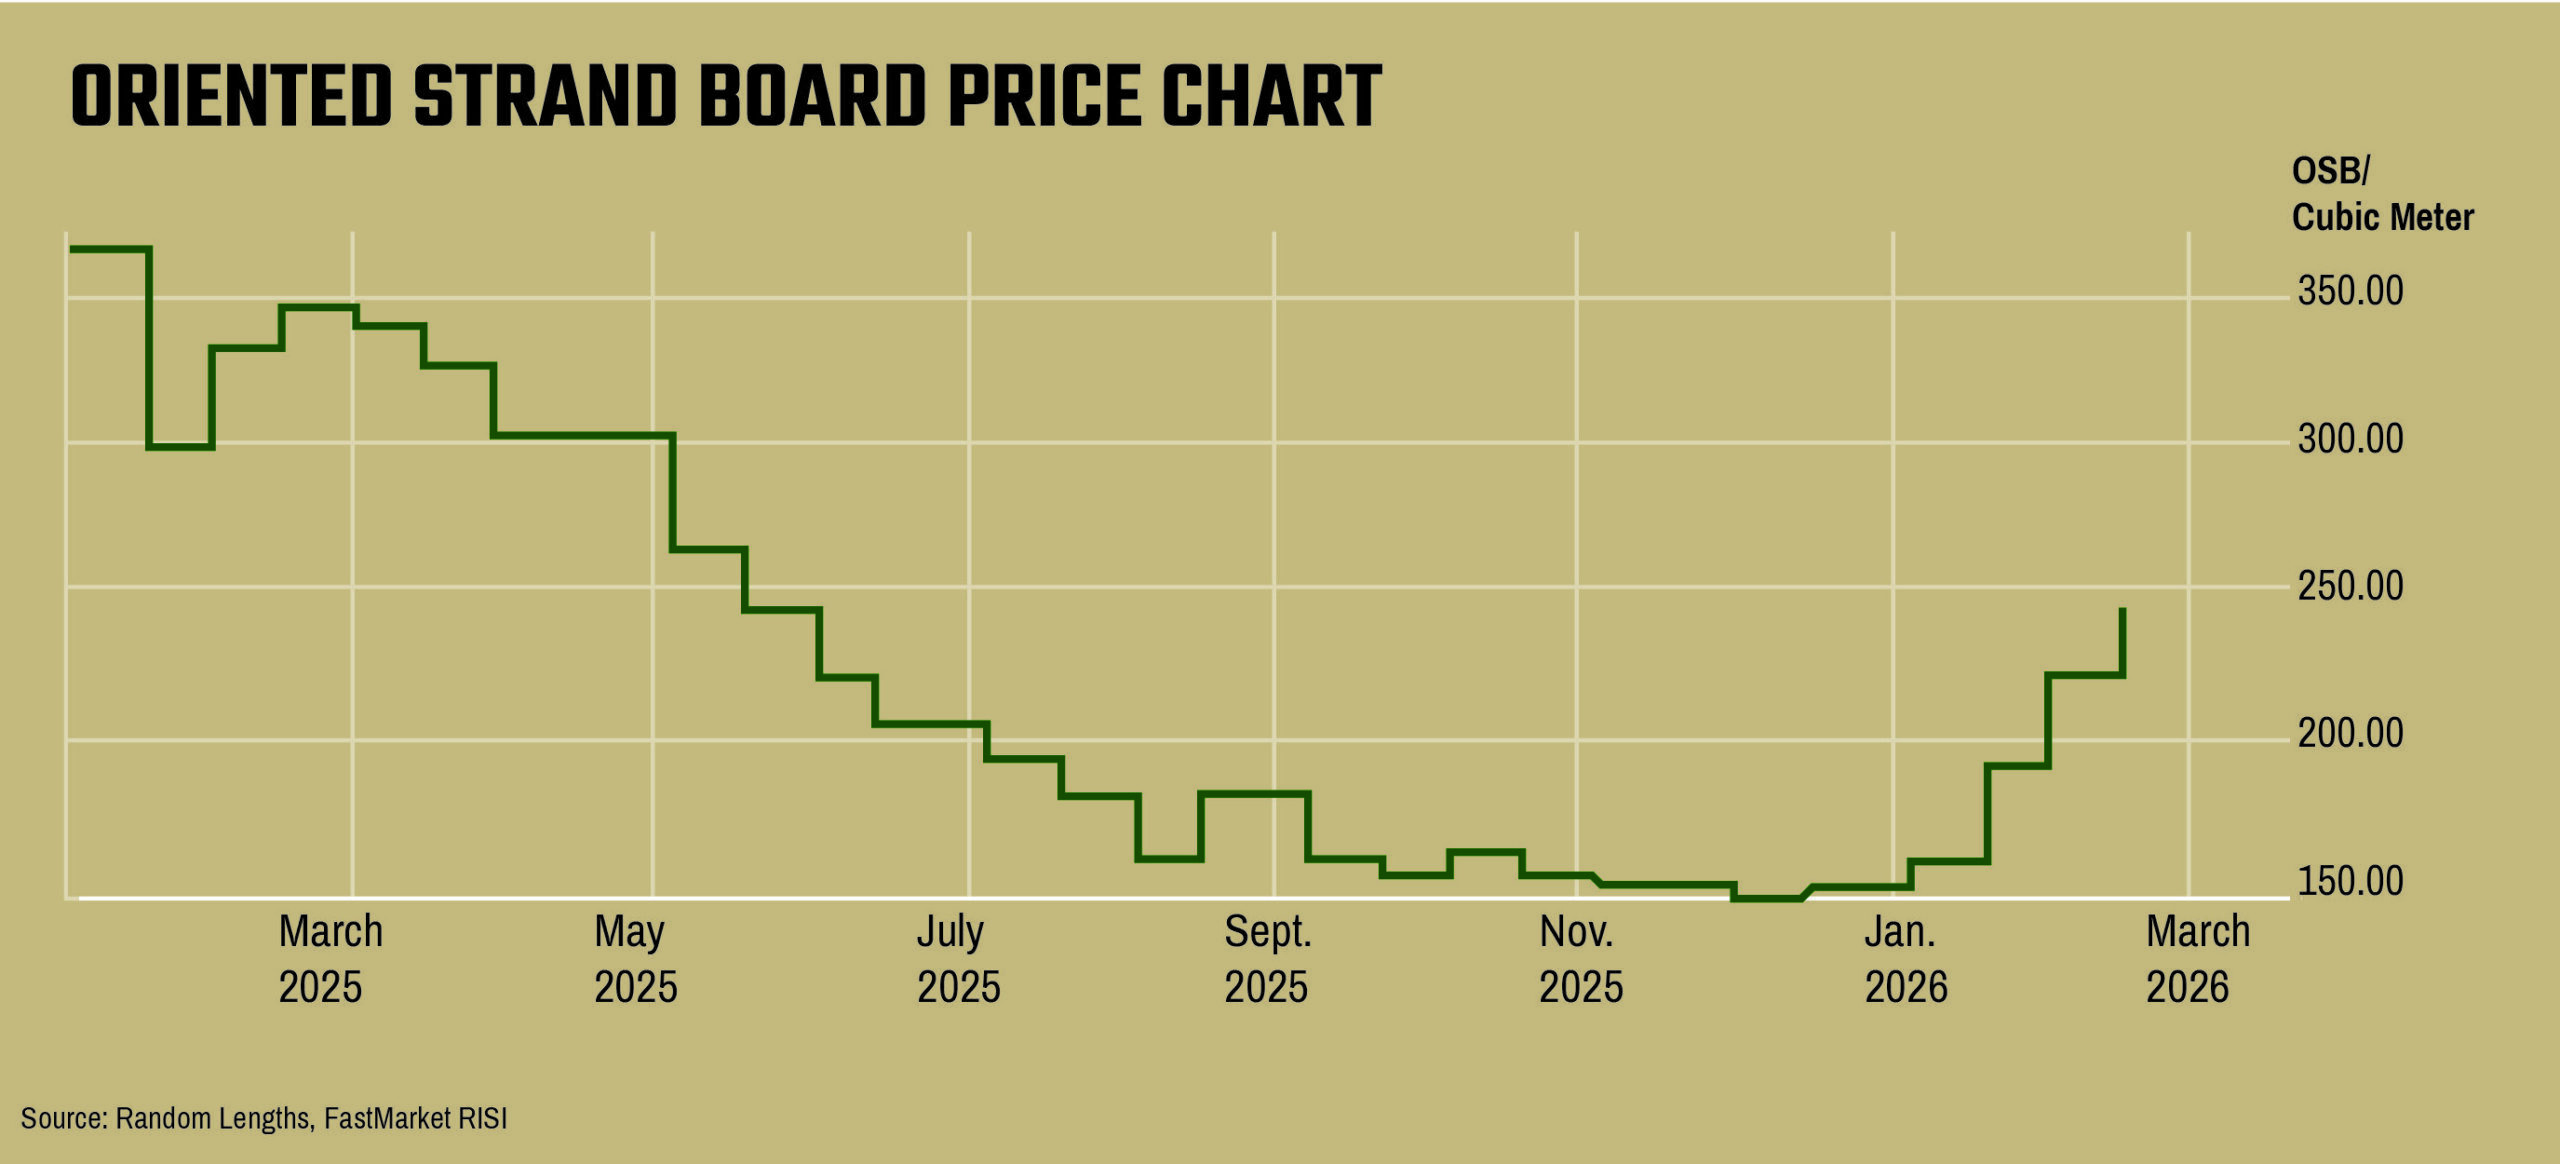
It is hard to believe that we are already approaching the end of the first quarter as I write this letter. It feels like we were just negotiating our 2026 OSB contracts, and here we are closing out the third month of those agreements. Thank you for your continued loyalty and genuine partnership.
We began 2026 with annual mill maintenance outages quickly approaching. Our team executed inventory build plans in both Corrigan and Oakdale to support your needs through our scheduled downtime. Unfortunately, extreme winter weather created unexpected challenges in executing those plans. Winter storm Fern swept across the South in late January, right as we were amidst our outage in Corrigan, TX. The freezing temperatures not only hampered transportation, but they stalled outage progress work as well. With temperatures remaining below freezing for multiple days, we made the decision to implement a controlled shut down across all production facilities. Safety is always our top priority at RoyOMartin, and we cannot operate our mills safely and effectively under those conditions.
This “perfect storm” of sorts resulted in extended outage time in Corrigan and significant lost production in Oakdale. We did our absolute best to keep you informed as the situation developed and evolved along the way, and I hope that communication helped you plan as effectively as possible. Our teams responded with urgency and commitment to bring our facilities back online as quickly as conditions allowed.
In addition, we made the decision to push our Oakdale outage from February to October. This decision was driven by our commitment to supporting your needs and minimizing further disruption. We take pride in making decisions that best serve our customers, and this is just another example of that commitment. Thank you for your patience and understanding as we worked through these challenges.
Looking ahead, there remains uncertainty around what the upcoming quarter will bring for the structural panel market. However, most sources suggest that 2026 may closely mirror 2025 from a home starts perspective. We hear about many of the same economic factors in play month after month: affordability constraints, mortgage rates, global uncertainty, and most recently, rising transportation costs, particularly with flatbed availability.
Regardless of market conditions, your team at RoyOMartin remains committed to producing high-quality structural panels and delivering industry-leading service. I cannot thank you enough for the continued partnership and trust.
")
As we move through the early months of 2026, it’s hard to believe how quickly the year is already taking shape. The close of 2025 was steady, with plywood moving consistently and pricing ending the year at levels considered stable.
January began with many buyers re-entering the market after working down inventory toward year end. Activity was steady, and pricing remained within a comfortable range. However, winter weather across the South quickly disrupted that momentum. Prolonged periods of freezing temperatures, along with ice and snow in many areas, forced several mills to curtail or halt production. Without fire suppression capabilities in subfreezing conditions, many facilities experienced multiple days of downtime.
In late February, our Chopin facility completed its annual outage, with the plant down for nine days. The outage was executed safely and successfully, with several key improvements underway, including the installation of a second route and fill, a new green composer, and the ongoing rebuild of the #7 dryer. These investments position us well as we move further into the year.
As we transition into spring, both box stores and distribution channels have begun their seasonal purchasing activity. While demand is showing signs of improvement, broader global uncertainty continues to influence the market, and many are watching closely as geopolitical developments unfold.
As always, our focus remains consistent. We are committed to operating safely, maintaining product quality, and supporting our customers and team members. By continuing to provide a diverse product mix and dependable service, we are well positioned to navigate the current environment and support our partners in the months ahead.
We appreciate your continued partnership and look forward to working together as the market develops.